CS 184: COMPUTER GRAPHICS
QUESTIONS OF THE DAY:
(1.) You want to fill the displays below with a giant, fat, page-filling, red cross:


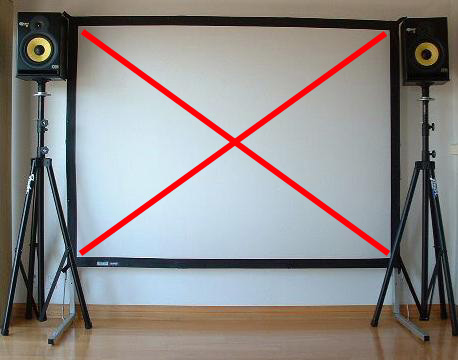
How do you express this goal ( == program it ) in a graphics system ?
Which of these devices are "calligraphic" output devices ?
|
(2.) Suppose, some application program
wants to display the line segment
between
points ( 0, 0.125 ) and ( root(0.5), pi )
on the square screen shown at left, . . .
-- how do you accomplish this ?
|
PREVIOUS
< - - - - > CS
184 HOME < - - - - > CURRENT
< - - - - > NEXT
Lecture #2 -- Mon 1/24/2011.
Discussion of the issues raised by the question above ...
It would be nice if we did not have to write a different program for every single output device ...
==> Create the proper abstractions and the proper default coordinate systems.
Let the (x,
y) coordinate pairs refer to a standard rectangular viewport frame
with
(0, 0) in the lower left corner and (1, 1) in the upper right corner.
If the line extends beyond the boundaries of the viewport, it needs to
be clipped to stay within that rectangular frame.
Then we just draw
the visible part of the segment.
The endpoints of a specified line segment may NOT coincide with
integer pixel coordinates.
-- What do you do then ?
Drawing (Visible) Line Segments: Abstraction and Implementation
Standard Line-Drawing Abstractions (e.g., OpenGL API)
==>
Pre-coded routines to do the low-level work for you:
Moveto(Pt),
Lineto(Pt),
Begin PolyLine -- Pt -- Pt -- Pt -- ... -- Pt -- End PolyLine.
Abstractions are important ! (you may not know what display device your program will face).
You will use such routines in your first programming assignment,
A#1.
Assignment A#1: How to draw lines interactively on a raster device.
You will be using a mouse to define vertices on the
screen,
which then get automatically connected by straight line segments.
A whole lot of detailed stuff will happen "under the hood" -- but
you don't have to worry about that!
This is what you will see: Demo of A#1-applet.
With just a little effort you might obtain an outline drawing like this "evol1.gif"
In assignment A#2, you will then interactively modify that contour into a different shape, e.g.: "evol2.gif"
(an "evolved" creature -- inspired by Darwin).
Then, as you change the interpolation coefficient between 0.0 and 1.0, you can see evolution in action: "evol3.gif".
To make a particularly neat demo, you should try to maintain
functionalities from shape_1 to shape_2,
e.g. have the same vertices in
the two polgon B-rep chains represent the eye, the mouth, the tail ...,
and perhaps have two fins on the fish that turn into the legs of the
alligator.
During the morph process, the creature may also move on the
screen, say from left to right.
Be creative ! (But not a creationist! :-)
Now, what goes on "under the hood"?
Line-Drawing on Calligraphic Devices, e.g., Line-drawing
CRT:
==> Sweep the (laser or electron)-beam (or a pen) from A to B:
To do this sweep in a time interval dt:
-- move beam (or pen) to location (Ax, Ay) and turn beam on (put pen down on paper);
--
simultaneously increase x-position proportional to (Bx-Ax)/dt and
y-position proportional to (By-Ay)/dt,
thus creating a slanted linear
motion;
-- turn beam off at location (Bx, By) (lift pen off paper).
Line-Drawing on a Raster Devices:
==> Figure out which set of matrix
elements need to be turned on:
First, let's just assume a B/W raster display with say 800 by 600 pixels (= small dots that can be individually turned on/off).
Foil: How to draw a banana or a thin line ?What is all the information needed to completely specify a desired line ?
Foil: Which
PIXELS should be turned on ?
Look up: Bresenham or DDA algorithms to efficiently turn on "the right" pixels for a thisn line. [Shirley2: Ch.3.5]{Shirley3: Ch.8.1.1}
What else do we need to control a color raster device?
A more detailed look at a Frame
Buffer -- the heart of a raster device:
-- bit planes: depends on how many different colors you want to see simultaneously.
-- color map: input = # of bit planes; output = # of inputs to
all Digital-to-Analog-Converters (DACs),
-- DACs to set the 3 intensities for RGB
-- The 3 RGB intensity signals determine the color of one pixel
displayed on the CRT.
Abstractions are important everywhere in Graphics -- also for input / interaction devices!
These are some of the physical input devices that you may encounter:
Keyboard (input character codes),
Lightpen (absolute positioning on screen),
Tablet (absolute positioning on desktop),
Mouse (relative positioning),
Trackball (relative positioning),
Joystick (velocity control),
SpaceBall (6 DoF velocity control),
Polhemus Magnetic Wand (3D position input),
Data Glove (3D position and gesture input),
Haptic stylus,
Wii (Nintendo)
...
All these devices need to be supported with proper software.
To reduce that burden and to exploit the conceptual similarities of
many of these devices,
a few "logical input devices" are defined with corresponding
generally usable APIs.
One typically defines for each device a "measure" describing
the value(s) returned by the device,
and a "trigger" which is a signal that generates an event in
the graphics program.
PHIGS and GKS (two standard graphics frameworks) define six conceptual logical input devices:
- String: Get a string of text.
- Locator: Return the coordinates of a position on the
screen.
- Pick: Find the primitive(s) under the current cursor
location.
- Choice: Select one of several different options (e.g.,
function keys).
- Valuator: Return the value from a slider or dial.
- Stroke: Capture a polyline of many subsequent cursor
positions.
OpenGL works at a slightly lower level; many of the above functions
are synthesized
from basic position information and appropriate context-sensitive
software;
these pieces of the user interface, often associated with separate
small windows
(e.g., pull-down menues or sliders), are also called "widgets". Different relationships between the measure process and the trigger
event define different input modes:
- Request Mode: The measure is sent to the computer upon
request by a trigger activation.
- Sampling Mode: The measure is read immediately upon the
corresponding function call.
- Event Mode: Trigger actions place measure values on an
event queue. Callback functions respond to these events. (This is the preferred interaction mode for client-server systems.)
All this may not look too interesting right no, where you may not have seen yet many different devices.
But keep these concepts in mind as you program and as you broaden your graphics experience.
Object Representation for Computer Graphics and CAD
We need to distinguish between modeling and rendering.
In the modeling phase we create a virtual object or scene described in some suitable datastructure of file format.
In the rendering phase we create an image (projection, display) of this model from a particular
viewpoint; for that we need:
- a representation of
the scene (geometry, surface colors, materials),
- a specification of a camera (observer,
viewer),
- a definition of the illumination
present (various lights).
In general, one wants to preserve the objects that one has
created
(e.g., your polygon of A#1).
How can you do that ?
-- Core dump from memory ?
-- Printing out all data structures ?
-- A terse minimal set of information that will permit to
recreate the polygon ?
It would be great if somebody else also could read your data and draw
your polygon ...
==> We need a standard polygon
interchange format !
This is also true for the more complicated objects that you will create
later in the course.
This year we are going to use a rather simple format based on the
commercially used OBJ format;
We will extend it as we need it, and thus
call it: " OBJ* ".
The main features of any of these file formats are:
- compact, yet readable and editable format;
- easy to parse, and extensible syntax;
- geometry is contained in the vertex coordinates, in the instance placements, and in positional transformations;
- topology information is explicitly captured in connectivity between
vertices via edges and faces;
This is called a "boundary representation" or "B-rep" for
short,
(We omit discussion of hierarchy and time-dependence for today).
For Assignment #1 you only need to know the constructs: point and face.
A closed poly-line can be considered the B-rep for a single polygon.
This B-rep can easily be extended to 3-dimensional objects, where a collection of faces form a ("water-tight") shell or hull.
Reading Assignments:
Study: ( i.e., try to understand fully, so that you can answer
questions
on an exam):
Shirley, 2nd Ed: Ch 3.1, 3.3, 3.5;
Shirley, 3rd Ed: Ch 3.1, 3.3, 8.1.1.
Skim: ( to get a first idea of what will be discussed in the future,
try to remember the grand ideas, but don't worry about the
details yet):
Shirley, 2nd Ed: Ch 3.6;
Shirley, 3rd Ed: Ch 8.1.2.
Programming Assignments 1 and 2:
Both must be done individually.
Assignment #1 is due (electronically submitted) before Friday 1/28, 11:00pm.
Assignment #2 is due (electronically submitted) before Friday 2/4, 11:00pm.
PREVIOUS
< - - - - > CS
184 HOME < - - - - > CURRENT
< - - - - > NEXT
Page Editor: Carlo
H. Séquin