CS 184: COMPUTER GRAPHICS


PREVIOUS < - - - - > CS 184 HOME < - - - - > CURRENT < - - - - > NEXT

Lecture #26 -- Th: 12/02, 2004

Introduction to Color

There are many useful color spaces based on physics, the human eye, the needs of computer graphics, the way artists' paints mix ...

1D space:

Artists color wheel: "Rainbow colors": -Red-Orange-Yellow-Green-Blue-Purple-
What is red and green together ? ==> (dirty brown).

2D spaces: (more formal):

Cyan, Yellow, Magenta. ==> Subtractive mixing (filters, paint mixing).
For color printers add a good black ==> CYMK system

Computer Scientist’s wheel: 2D: Red, Green, Blue. ==> Additive mixing (light beams, CRT).

We are missing some colors: where is brown, olive, pink, dark blue ... ?

3D spaces:

Color space is 3-dimensional to accommodate also brightness/saturation variations in addition to hue:
Graphics hardware view: RGB cube, store 3 intensity values for display on CRT.
Extension of the additive color wheel to a cone (6-sided pyramid) ==> HSV.
Alternative: HLS: Double hex-cone. White/black at tips; saturated colors on rim at height 0.5.

Physical Colors

Physicist’s View: continuous spectrum, infinite dimensions.
Typical spectrum has some broad bumps plus some sharp spectral lines (added or subtracted).

Perceptual Colors

The human visual system has three types of cones. (Can only take 3 samples, each over relatively broad color bands).
Sensitivity of these cones differs: green most sensitive, blue the least.

METAMERS: colors that look the same (P), but have different spectrum(L1, L2).

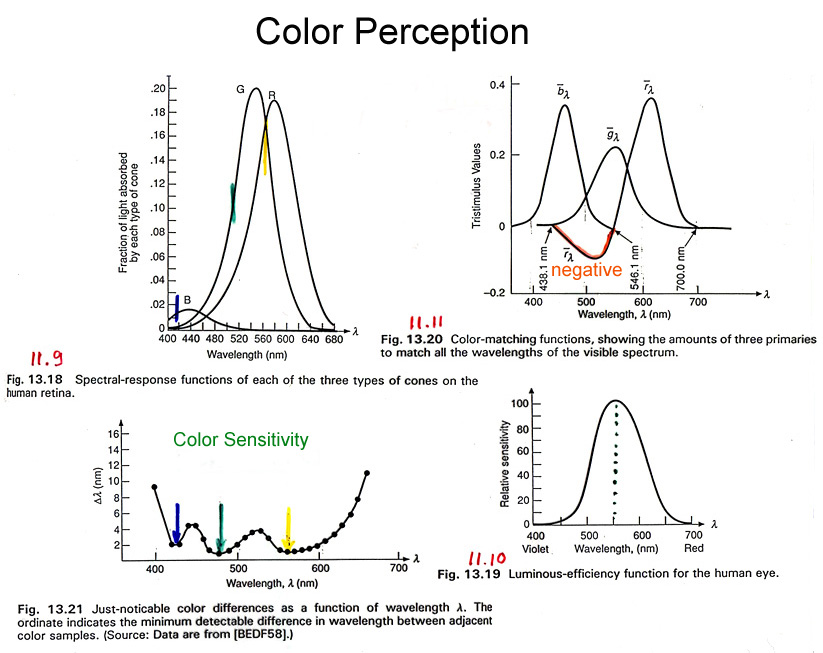
Comparative measurements are done with a color-matching  set-up:

3 superposed lights (A,B,C) are compared with test color (T).
You can match almost all, but not all, colors as far as human perception goes.
The remainder can be matched when one of the 3 colors is placed on the test light to produce a subtractive effect.
This results in color matching functions with positive and negative coefficients.
==> Perceptual space is 3-dimensional. (1st Grassmann Law )

Grassman’s Laws:

(Grassman measured RGB coordinates of all perceptual colors in 5nm steps, 1931)

1.  Perceptual space is 3-dimensional.
(see above)

2. Metamer mix (add) to yield metamers:
L1, L1’ -> P1;  L2, L2’ -> P2;  then for any a, b :  a*L1 + b*L2 -> P3; then a*L1’ + b*L2’-> P3.
(not true for paints or pigments with non-additive behavior; see example with filter below).

3. As physical color is varied continuously, perceptual color also varies continuously.
(continuity of the perceptual process).
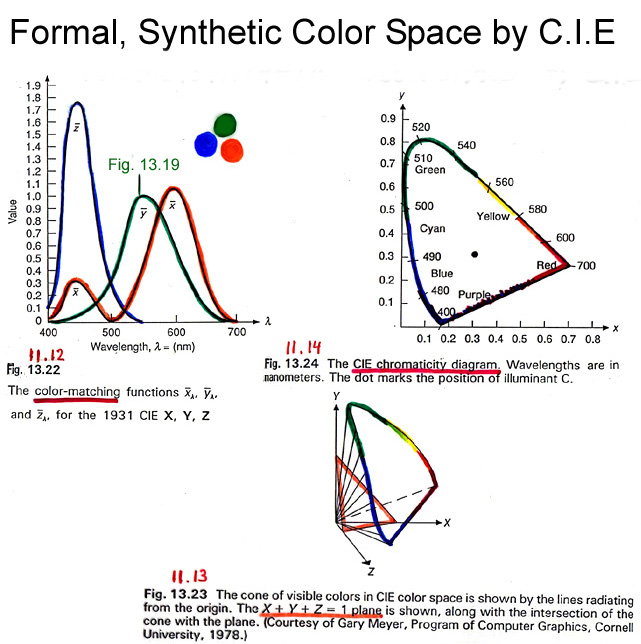
 

The Human Visual System and the CIE Diagram

The human retina has three kinds of color sensors (cones) with peak sensitivities
near 440nm (blue), 545nm (yellow-green), and 580nm (orange) in the visual part of the spectrum.
The blue sensor is much less responsive than the other two (Foley Fig.13.18).
(There are also "rods" that are more sensitive, but are essentially black&white sensors).
This leads to the tri-stimulus theory of color perception: which postulates that colors can be synthesized
from weighted sums of some primary colors, typically in the red, green, and blue range.
However this is not possible with only positive weighting factors;
some blue-green components of the spectrum require a negatively weighted red component (Foley Fig.13.20).
This means that the desired color sample has to be de-saturated with some red light,
so it can then be matched by positive blue and green components.
Frequency sensitivity of the eye varies from about 2nm for yellow and blue to about 10nm near the edge of the visible spectrum.
Overall, about 128 fully saturated hues can be distinguished.

A perceptual color space was formally defined in 1931 by the Commission International de l’Eclairage (CIE).
To avoid the need for negative weights, they defined a new set of basis vectors (primary colors) X, Y, Z,
that lie completely outside the range of all visible RGB values,
so that the color matching functions x(l), y(l), z(l) for any visible hue become entirely positive (Foley Fig.13.22).
In addition, the y(l) function is defined so that it matches the luminosity-efficiency of the human eye (Foley Fig.13.19);
thus it can be used by itself as an intensity channel.
The transformation from the original RGB color matching functions to the CIE color matching functions is linear.
If we intersect the visible portion of the CIE color space with a plane X+Y+Z=1 (about equal brightness),
then we get the horseshoe-shaped region depicted in the CIE chromaticity diagram.
The fully saturated, pure, spectral colors all lie on the curved part of the horseshoe.
Somewhere near the center is a point defined as "white".
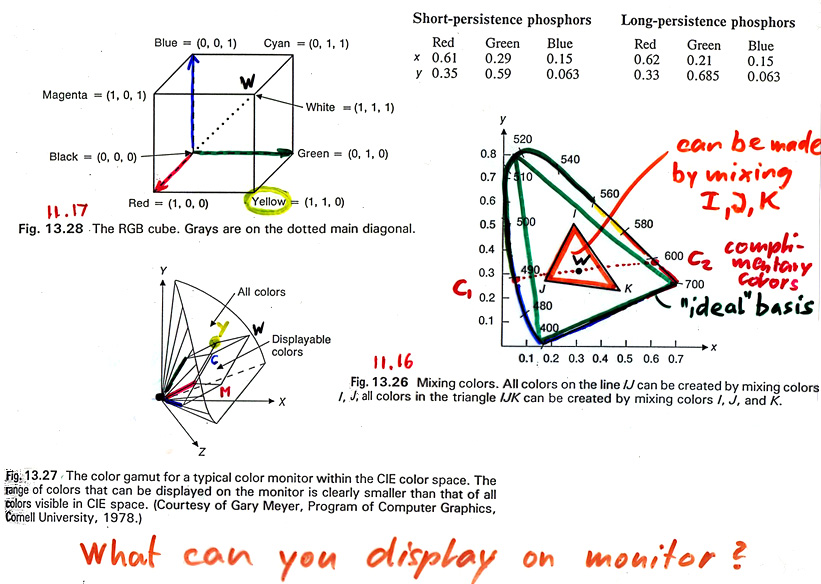
Colors lying opposite this "white" point are called complementary colors (Foley Fig.13.26).

A particular tri-stimulus (3-color) display system has three primaries: I,J,K (Foley Fig.13.27).
It can display only the colors that lie within its convex hull (=triangle).
(Can only use linear combinations of the 3 base colors with coefficients [0,1]).
Thus we would like to make this triangle as large as possible (-> "ideal basis"),
but we are limited by what colors of phosphor (or LED's, or gas-discharge) are available.
The typical CRT display can cover less than half of the visible domain of colors.  
 

Learning by Doing:

-- Check out these cool applets from Brown University!

Additive Mixing
Subtractive Mixing
Metamers
Color Mixing/Filtering Combination
and many more ...


Reading Assignment:

Study: 2ndEd: Ch 7.12,  8.9.2-8.9.3,
Study: 3rdEd: Ch 8.13,  9.10.3-9.10.4,

ASG#10  Final Project

Project Due Date is Monday, December 13, 7:59pm.


PREVIOUS < - - - - > CS 184 HOME < - - - - > CURRENT < - - - - > NEXT
Page Editor: Carlo H. Séquin