This document describes various interactive tools we've programmed in the pursuit of optical character recognition of mathematical expressions. It is also not very far from an outline of "the middle" of what OCR programs do, in general. (The first part is low-level picture acquisition: scanning, thresholding, simple noise removal; the last part is spelling correction and conversion to appropriate formatting such as ASCII or RTF.)
Traditional OCR programs have a real problem in dealing with mathematics because this material tends to violate the heuristics used in ordinary text recognition. The characters vary in size, even on the same "lines." The characters are not aligned uniformly on a baseline, but may include super- or subscripts, divide bars, primes, etc. The characters do not appear in "words" that can be checked in a spelling dictionary. The mathematical symbol set includes a variety of unusual characters. Furthermore, not all mathematics occurs in set-off displays. Often it occurs in-line in the midst of ordinary text.
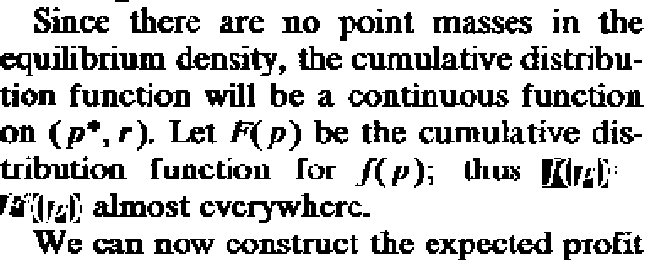
Now we believe that one requirement for highly accurate OCR is very accurate partitioning (zoning) of material into mathematics and ordinary text. (We hope that with experience, we will be able to relax this requirement, but all high-accuracy OCR programs today seem to rely on heuristics that fail on mathematics). This separationd could be done automatically, and we are working on it, or it can be done by human intervention. Even if we attempt to do this separation automatically, it is unlikely to be done perfectly, and so it is worthwhile to see how we would correct any erroneous classification. Correction and ab initio delineation of the math components require about the same tools. Consequently, we have written a number of tools to interact with OCR.
All the tools require the human to be able to see, sometimes in great detail, the material that has been scanned. Because the screen resolution is so much less than usual scan resolution, one can't see it all on screen all at the same time.
Therefore, the first tool is an interactive zoom and pan control for looking at the page.
This would be routine and rather uninteresting except that the real size of the pages we are handling are about 6600 by 5800 dots. The operations cannot be done by "bitblt" operations on a graphics memory plane. The display must be recomputed from some other representation. In the case of our program (and apparently many of the commercial systems) a run-length-encoded version of the page image is really being manipulated.
The task would also be straightforward if we didn't have a very strenuous requirement for speed (fast redisplay) and human convenience (i.e. minimal mouse movements).
In the following sequence we illustrate pan/zoom manipulation by a succession of X-window screen dumps. For a start, notice the page image in the large window below, as well as the miniature version "thumbnail" of that image. (In actuality one can change the sizes of these windows with the usual window controls, though the two windows will always be congruent to each other.)
Even at this poor resolution, you can see two columns of text in the large window and the thumbnail. Not apparent here is the colored rectangle that frames the thumbnail inner pane.
If you place your mouse in the thumbnail window and press the left mouse button, the cursor changes, warps to the nearest corner (say the left bottom one for illustrative purposes). This reminds you that you can now change the size of the frame. If you scoot it towards the upper right, the inside of the frame now encloses a smaller portion of the page, which can consequently be enlarged. Releasing the mouse button reveals this:
Your mouse is still in the thumbnail window (we try to keep you from wasting mouse motions). Press the middle mouse button. The cursor changes and warps to the center of the frame. This reminds you that you can now move the frame. If you scoot it toward the middle of the thumbnail, the inside of the frame now encloses a central portion of the page, which can consequently be displayed in the bid window. Releasing the mouse button makes it happen. The redisplay takes a fraction of a second.
You can zoom in to the pixel level.
Reminder: the point of these manipulations is to enable you to look at the image of the page at any scale. Initially the full page, but on request at any magnification. Now we explain the typical sequence of processing steps for a page in the "middle" part of OCR.
Read-In, Deskewing
These two steps do not generally require interaction: we read the page from a tif file, and automatically deskew the page to remove any slight systematic rotation that might have been introduced by errors in printing, copying, scanning etc. The subsequent steps below can also be done without human interaction, but the probability of doing them entirely correctly is quite low.
Zoning
We compute zones heuristically as follows: First scan the page to form a set of connected components (ccs). A connected component is the (maximal) group of black pixels touching a chosen black pixel by following paths of black pixels (a pixel touches 8 others, including diagonals).
For each cc we compute bounding (rectangular) bounding boxes (bbs) around those components.
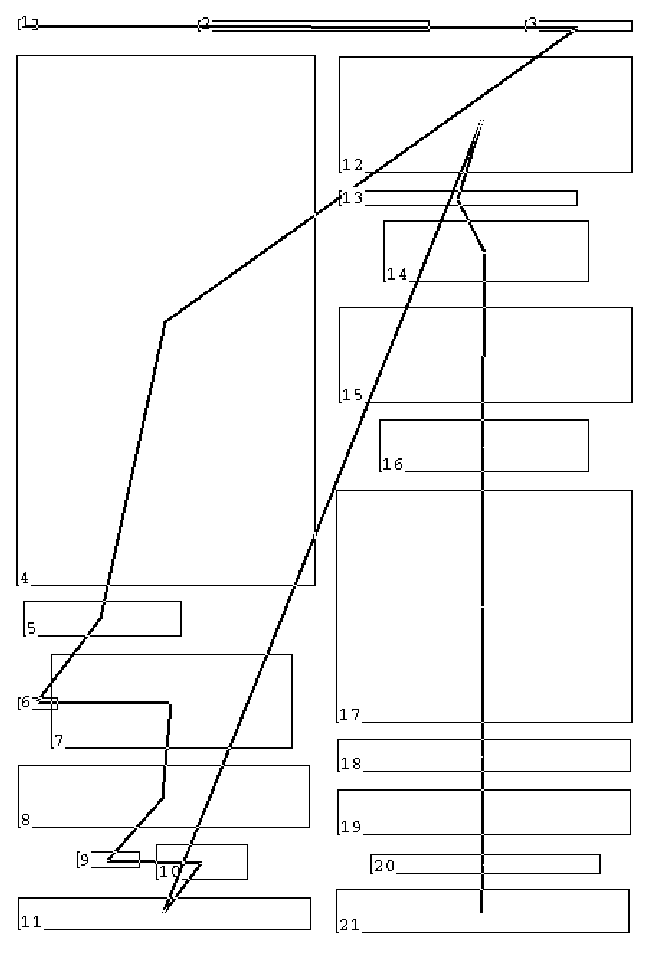
These bounding boxes may overlap. If two bbs are horizontally within some pixel distance hs (horizontal smear) we construct a new bb, a rectangle enclosing them both. If two bbs are vertically within vs (vertical smear) they are similarly but in a new bb. These criteria are repeatedly applied until no more bbs can be merged. These boxes are called zones. We show a closeup of the default zones below.
Depending on the use you wish to make of this zone concept, the ones chosen here may be too large or too small. If the zones are intended to be words or lines, these are definitely too large. If the zones are intended to be columns, these are too small. You make your choice depending on further processing. (The process of automatically finding column breaks and separating headings from abstracts from paragraphs, etc, is the subject of numerous technical papers).
The tool we've written allows the user to control, by means of sliders, the hs and vs parameters. The new zones are computed and displayed in a fraction of a second, and once set, we hope need not be readjusted for subsequent pages of the same document. There are other parameters that can be set that deal with issues of noise (if there are very small objects, or very large objects, they may interfere with the zoning. These parameters determine filter levels. To illustrate what a decrease in vs will do, and also show the sliders, we provide the picture below. (The sliders are in a separate window and can be placed anywhere on the screen). Using this simple strategy, the automatic zoning may make some mistakes. If these matter, a human can, with a swipe of the mouse using rubber-band rectangles for grouping, link zones together. It is also easy to choose a zone and with a mouse selection, explode it into bounding boxes. These bits can then be rejoined selectively, in the usual way.
The next step is to provide a read-ordering of the zones. It is not obvious why this is necessary. It is almost universally the case that one reads (English at least) from top to bottom. The ordering is not so obvious in the case of this page, which has two columns, and which fooled at least one commercial OCR package into thinking the left column ended above the last display equation. We can specify the read order by hand, by clicking once in each zone; the computer keeps track of the order and displays a line linking the centers of the zones in order. The results look something like this, for our picture.
We are now able to go through the zones one at a time and pick out, by forming the union of a sent of bounding boxes, incorporated mathematics. (An in-line mathematical formula does not, in general, fit inside a single rectangle. It may be the union of disjoint rectangles on several lines, and in fact the bbs of large symbols sometimes impinge on lines above and below. We are not at all inclined to "spread" mathematics to form mathematics zones. In the figure below we have selected the equation f(x)=F'(x) in one of the zones. Its appearance in this illustration only suggests the result; the on-screen interaction displays selected mathematics in contrasting colors.
Assume now that we have gone through this and all subsequent zones and either designated them "entirely mathematics" or "entirely text" or "text but with specified section of math".
How are characters recognized? Recall that in our (deliberately simplified) model for OCR of mathematics we have claimed that each character is one connected component (cc). This is manifestly untrue for characters that have multiple pieces (like ij%=;:!) and generally unreliable in noisy documents where characters can be broken at thin places, or merged with other nearby characters.
Nevertheless, it is our intention to try to do the best we can with our simple model, and patch together the pieces that remain.
The next step on our path is to look at some text samples. Given a page of text, we will find a few thousand ccs. Our approach has been to measure each of the ccs by imposing a 5 by 5 grid on its bounding box, and measuring a "gray scale" for each section, encoding this as 0 (all white) to 255 (all black). Therefore each letter (regardless of size) is reduced to 25 bytes of data. (Actually we have simplified this for exposition, but that's the basic idea.) Each character is then a point in 25-dimensional space.
Set up a clustering algorithm of the simplest type: all characters within some Euclidean distance D of each other are put into the same cluster. An average location for that cluster is used as a key.
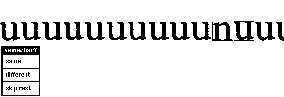
The clusters are then individually examined (by eye) to see if they are accurately separating letters, and in the case of mistakes, elements are rejected. For example, in the section below, a letter "n" has been accepted as a "u". The human rejects this (tosses it out of the cluster), and lets the rest of the examples remain. The rejected letter will either form its own cluster (as a renegade n) or perhaps be joined with other similar letters in a cluster.
At this point the computer does not know that the pattern given above is the ascii character "u". (Roman, lower case). A run-through of the clusters with a human typing in the identification, then associates glyph-names with the points we have identified with the clusters. These are, for the most part widely spaced in the space of all characters.
This method of clustering is not the way commercial OCR classifiers work, but it is, in practice, quite good on clean input, and a modest size character set. It appears that under these conditions most plausible techniques can be made to work well with some experimentation. For even slightly noisy input and/or an "omnifont" set, the accuracy of commercial OCR programs drops rapidly. A page that (to a human) looks nearly indistinguishable from a perfectly clean printout, but actually is somewhat noisy, may result in a drop in accuracy from 99% to 90%.
There are many plausible alternatives to the choices we made in this design. A large number are covered in the literature, some of which have been incorporated in programs.
Returning now to the zone geometry on the pages, ideally, we can now unambiguously identify each character in each zone. We also know the position for each character. For text, we attempt to group the characters by word and line, providing an ascii transcript or other interpretation. (If we are uncertain of the character identification, we can try to make plausible substitutions using a spelling corrector.) For mathematics, we group the characters according to geometrical relationship (horizontal, vertical, super/sub script locations), and then attempt to parse this 2-D arrangement into an internal mathematical notation. The resulting rotation, in our own work, is a typical lisp parenthesized prefix data structure. From this representation we can convert to TeX or (in some cases) we can generate input to a computer algebra system such as Macsyma, Maple, Mathematica, etc.
More details on many aspects of the Berkeley code are available on request. An excellent source for further reading on OCR and document analysis is the collection of papers edited by O'Gorman and Kasturi, Document Structure Analysis, published by IEEE-Computer Society.
The associated code was last revised December 13, 1996.
Email:
fateman@cs.berkeley.edu