
 OPTICAL Software Visualization Suite
The applications in our visualization suite are:
-
 Videokeratograph Simulator
-
 Optical Power Visualization
-
 Fluorescein Simulator
-
 Sphere/Cylinder Visualization
-
 Computer Aided Contact Lens Design
Videokeratograph Simulator
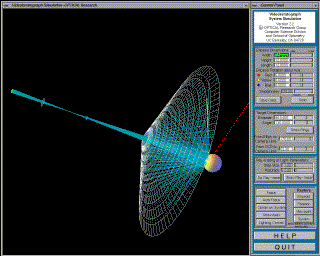 This application allows us to simulate a videokeratograph, which is a
device used to extract shape information from a patient's cornea.
With this device, light rays (cyan lines in the image below) emanate
from the rings of light (white mesh), bounce off the front of the
cornea (here simulated by an ellipsoid on the right), pass through the
lens, and fall on the image plane of the video camera on the far
left. We simulate this process using a technique called backward
ray-tracing, in which the rays of light start at the image, pass
through the lens, and bounce off the cornea. This technique checks if
the rays hit the rings of light. If they don't, this method adjusts
the starting position of the rays and continues until all rays have
hit the rings of light. The system has the capability to save this
information into a file with exactly the same format as that created
by the real videokeratograph.
Optical Power Visualization (in Diopters)
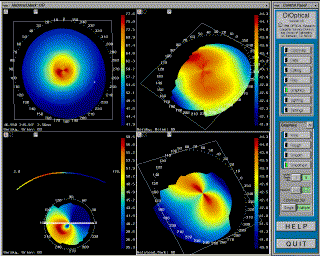 This is the flagship application in our visualization software
suite. It reads in the files generated from a videokeratograph (or
from our videokeratograph
simulator) and then displays them using various techniques. It can
display the optic power (measured in diopters) on a 2-D image (upper-left)
or as a color-coding on top of the actual 3-D data (upper- and
lower-right). It can shade the 3-D data using traditional computer
graphics lighting methods, and has the ability to take a cross-section
of the data (lower-left). It also has multiple-file capabilities,
allowing many datasets to be viewed simultaneously, as well as
extensive colormap editing features.
Fluorescein Simulator
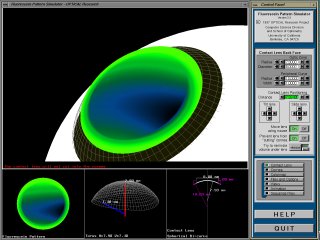 This simulates the results of a traditional technique in which
clinicians place a contact lens of known dimensions in the patient's
eye, apply fluorescein dye and shine a light on the lens. The
fluorescein forms a pattern in which brightness is related to the
distance of the lens from the cornea. Our application allows a user to
interactively choose parameters describing the simulated contact lens,
and then it shades the dataset. The image below displays sclera of
the eye (white surface), cornea (white mesh), and contact lens
fluorescein pattern (green). The smaller sub-windows show a top-level
view of the pattern, a 3-D mesh of the contact lens shape, and the
specific contact lens parameters. Here is an image of a simulated fluorescein
pattern with a more accurate colormap:
Simulated fluorescein pattern
using a mathematical surface representation
of a patient's cornea with a spherical contact lens,
displayed with a photorealistic colormap
Sphere/Cylinder Visualization
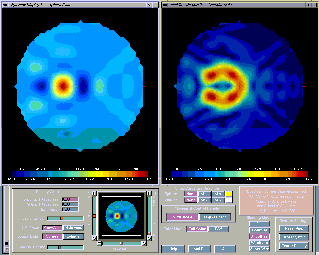 This application is used to illustrate a new technique for visualizing
shape information. One of the shortcomings of displaying corneal power
is that there is an inherent singularity in the center of the data
since the curvature is calculated radially. This application solves
that problem by color-coding the data based on Sphere (the average of
the maximum and minimum curvature, on the left) and Cylinder (the
difference of the maximum and minimum curvatures, the image on the
right). The advantage of this technique is that these quantities are
continuous in the center and do not depend on an arbitrarily-chosen
'center' of the data about which to calculate curvature.
Computer Aided Contact Lens Design
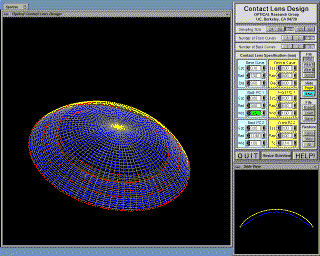 This application allows the specification of various parameters for
contact lenses and the interactive visualization of the results. This
is a very useful tool for teaching student clinicians how the
different parameters affect shape information as well as for
specifying the shape of the lens to be simulated in the Fluorescein simulator.
Copyright © 1998 OPTICAL Research Project. All rights reserved.
WWW Maven: Dan Garcia (ddgarcia@cs.berkeley.edu)  Send me feedback


 OPTICAL Software Visualization Suite
 This application allows us to simulate a videokeratograph, which is a
device used to extract shape information from a patient's cornea.
With this device, light rays (cyan lines in the image below) emanate
from the rings of light (white mesh), bounce off the front of the
cornea (here simulated by an ellipsoid on the right), pass through the
lens, and fall on the image plane of the video camera on the far
left. We simulate this process using a technique called backward
ray-tracing, in which the rays of light start at the image, pass
through the lens, and bounce off the cornea. This technique checks if
the rays hit the rings of light. If they don't, this method adjusts
the starting position of the rays and continues until all rays have
hit the rings of light. The system has the capability to save this
information into a file with exactly the same format as that created
by the real videokeratograph.
 This is the flagship application in our visualization software
suite. It reads in the files generated from a videokeratograph (or
from our videokeratograph
simulator) and then displays them using various techniques. It can
display the optic power (measured in diopters) on a 2-D image (upper-left)
or as a color-coding on top of the actual 3-D data (upper- and
lower-right). It can shade the 3-D data using traditional computer
graphics lighting methods, and has the ability to take a cross-section
of the data (lower-left). It also has multiple-file capabilities,
allowing many datasets to be viewed simultaneously, as well as
extensive colormap editing features.
 This simulates the results of a traditional technique in which
clinicians place a contact lens of known dimensions in the patient's
eye, apply fluorescein dye and shine a light on the lens. The
fluorescein forms a pattern in which brightness is related to the
distance of the lens from the cornea. Our application allows a user to
interactively choose parameters describing the simulated contact lens,
and then it shades the dataset. The image below displays sclera of
the eye (white surface), cornea (white mesh), and contact lens
fluorescein pattern (green). The smaller sub-windows show a top-level
view of the pattern, a 3-D mesh of the contact lens shape, and the
specific contact lens parameters. Here is an image of a simulated fluorescein
pattern with a more accurate colormap:

 This application is used to illustrate a new technique for visualizing
shape information. One of the shortcomings of displaying corneal power
is that there is an inherent singularity in the center of the data
since the curvature is calculated radially. This application solves
that problem by color-coding the data based on Sphere (the average of
the maximum and minimum curvature, on the left) and Cylinder (the
difference of the maximum and minimum curvatures, the image on the
right). The advantage of this technique is that these quantities are
continuous in the center and do not depend on an arbitrarily-chosen
'center' of the data about which to calculate curvature.
 This application allows the specification of various parameters for
contact lenses and the interactive visualization of the results. This
is a very useful tool for teaching student clinicians how the
different parameters affect shape information as well as for
specifying the shape of the lens to be simulated in the Fluorescein simulator.